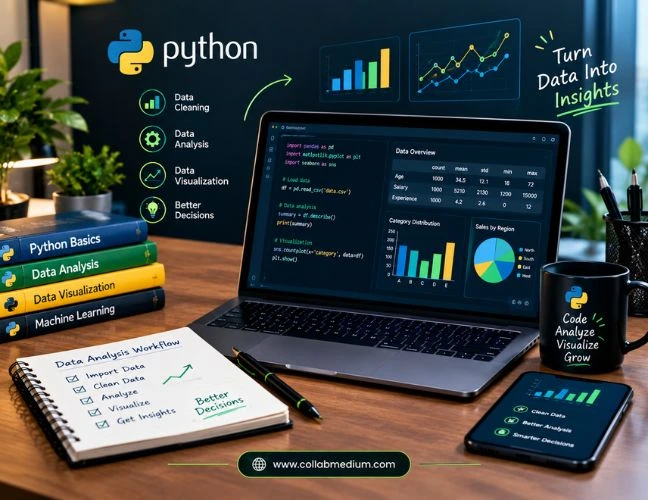
If you want the short answer, here it is. Python data analysis means using the Python programming language to clean, explore, and interpret data so you can make faster, smarter decisions. It works because Python is easy to read, backed by a massive community, and loaded with libraries built specifically for crunching numbers.
I have spent years working with datasets across marketing, finance, and product teams, and Python remains the fastest path from raw spreadsheet chaos to a clear answer. This guide breaks down what is Python, walks through python for data analysis in practical terms, and shows you exactly how python programming fits into real business workflows in 2026.
What Is Python and Why It Dominates Data Analysis
What is Python exactly? Python is a general-purpose programming language created by Guido van Rossum in 1991. It was designed around readability, which means its code looks closer to plain English than most other languages. That readability is a huge reason Python data analysis became the industry standard rather than a niche skill.
Python currently ranks first on the TIOBE Index at nearly 19 percent market share, according to Python developer statistics compiled by Uvik. More telling for this guide, over half of surveyed Python developers report working directly on data exploration and processing tasks. That number confirms Python data analysis is not a side use case. It is one of the language’s primary jobs.
The Libraries That Make This Kind of Analysis Possible
Python alone does not analyze data. Its ecosystem does the heavy lifting. Pandas handles structured data in table form. NumPy powers fast numerical calculations. Matplotlib and Seaborn turn raw numbers into charts. Together, these tools are why the process feels approachable even for people without a computer science background.
The Core Problem: Data Feels Overwhelming Without the Right Skills
Here is the pattern I see constantly among small teams and solo analysts. Someone inherits a messy spreadsheet with thousands of rows. They try to clean it manually, cell by cell. Formulas break. Copy-paste errors creep in. Hours disappear, and the final report still has mistakes hiding inside it.
Spreadsheets simply were not built for large, messy, real-world data. Once a file crosses a few hundred thousand rows, Excel slows down or crashes outright. That breaking point is exactly where Python data analysis becomes essential rather than optional.
Another common frustration is repetition. Analysts often repeat the same cleaning steps every single month for a recurring report. Manual work that could be automated in a few lines of code instead eats an entire afternoon, every time.
What Is Python for Data Analysis Used For in Real Businesses
What is Python for data analysis used for day to day? Marketing teams use it to combine data from multiple ad platforms into one clean report. Finance teams use it to forecast revenue and flag unusual transactions. Product teams use it to study user behavior and find drop-off points in an app. Across every case, Python data analysis replaces hours of manual spreadsheet work with a script that runs in seconds and produces the same result every time.
Practical Solutions: How to Start Python Data Analysis Step by Step
Getting started with Python data analysis does not require a computer science degree. Start by installing Python through Anaconda, which bundles the language with the most common data libraries already included. Open a Jupyter Notebook, since it lets you run small chunks of code and see results immediately.
Next, load a small dataset using Pandas. Practice basic tasks first. Filter rows, sort columns, and handle missing values before attempting anything advanced. Building this foundation prevents frustration later when real datasets get messier.
Once the basics feel comfortable, move into visualization. A simple bar chart or line graph often reveals a pattern that raw numbers hide completely. This step turns the work from a technical exercise into something a manager or client can actually understand at a glance.
A Python Tutorial Approach That Actually Sticks
A good Python tutorial does not start with theory. It starts with a real dataset and a real question. Pick something you care about, like your own budget or a hobby’s statistics. Working through a genuine problem keeps the learning curve from feeling abstract, which is where most beginners quit.
Python for Beginners Free: Where to Start Without Spending a Dime
Looking for python for beginners free resources? Python.org hosts free official documentation. Kaggle offers free micro-courses paired with real datasets. YouTube channels like freeCodeCamp post full-length beginner courses at no cost. Learning any new skill from scratch takes patience, and the process is not unlike picking up a new spoken language. Our guide to learning Russian covers the same core idea of building consistent daily practice, which applies just as well to learning Python’s syntax and structure.
Python Programming Fundamentals Every Analyst Should Know
Solid python programming habits matter more than clever tricks. Variables store your data. Functions let you reuse code instead of repeating it. Loops process large datasets row by row without manual effort. Conditional logic filters data based on rules you define.
Beyond syntax, good python programming practice also means writing readable code. Name your variables clearly. Comment on your logic. A script you cannot explain to a colleague six months from now was not written well, no matter how fast it runs.
Relevant Tools and Platforms for Python Data Analysis
Several platforms make this kind of work faster and more collaborative. Jupyter Notebook remains the standard for exploratory work, letting you mix code, charts, and notes in one document. Google Colab offers the same experience in the browser, with free access to cloud computing power.
VS Code has become a favorite among data professionals who want a fuller coding environment with extensions for debugging and version control. For teams working with genuinely large datasets, platforms like Databricks and Snowflake extend Python’s reach into distributed computing.
Data-driven decisions extend well beyond spreadsheets and scripts, too. If your team also relies on search data to guide content or SEO strategy, our free keyword research tool guide shows how the same instinct for data-backed decisions applies directly to marketing analysis, not just technical datasets.
Where Data Science, Artificial Intelligence, and Machine Learning Fit In
Python data analysis is often the first step toward more advanced work. Once you can clean and explore data confidently, the jump into data science becomes far less intimidating. Data science adds statistical modeling and prediction on top of the exploration skills you already built.
Artificial intelligence and machine learning take this even further. Roughly 80 percent of current machine learning and AI projects run on Python, largely because the same libraries used for basic analysis, like NumPy and Pandas, also feed directly into model training pipelines. Scikit-learn handles traditional machine learning tasks, while TensorFlow and PyTorch power deeper AI applications.
Python data analysis is not a separate track from data science and AI. It is the entry point that makes everything after it easier to grasp.
Comparing the Core Python Data Analysis Libraries
| Library | Primary Use | Best For | Skill Level |
| Pandas | Data manipulation | Cleaning and organizing tables | Beginner |
| NumPy | Numerical computing | Fast math on large arrays | Beginner to Intermediate |
| Matplotlib | Data visualization | Basic charts and graphs | Beginner |
| Seaborn | Statistical visualization | Polished, styled charts | Intermediate |
| Scikit-learn | Machine learning | Predictive models | Intermediate to Advanced |
Skill level reflects typical learning curve, not the complexity of every possible use case.
Common Mistakes to Avoid in Python Data Analysis
Skipping data cleaning. Jumping straight to charts or models without checking for duplicates, missing values, or incorrect types leads to misleading results.
Ignoring version control. Saving multiple copies of a script like “analysis_final_v3” instead of using Git creates confusion and lost work.
Overcomplicating early projects. Beginners often reach for machine learning before mastering basic filtering and grouping. Master the fundamentals first.
Not documenting the process. A script with no comments becomes unreadable within weeks, even to the person who wrote it.
Trusting output without checking it. A single wrong column reference can silently produce believable but incorrect numbers. Always spot check results against a known value.
Pro Tips From Years of Doing Python Data Analysis
Tip 1: Learn keyboard shortcuts in Jupyter. Simple shortcuts for running cells and adding new ones save real time across a long analysis session.
Tip 2: Build a personal snippet library. Save common code blocks you reuse often, like loading a CSV or plotting a quick chart, so you are not rewriting them constantly.
Tip 3: Practice with messy, real datasets. Clean textbook data does not prepare you for the real world. Sites like Kaggle offer genuinely messy datasets for practice.
Tip 4: Use virtual environments. Keeping project dependencies separate prevents one project’s library updates from breaking another project entirely.
Tip 5: Read other people’s code. Browsing well-written public projects on GitHub teaches patterns and shortcuts that tutorials rarely cover.
Frequently Asked Questions
What is Python data analysis?
Python data analysis is the process of using the Python programming language and its libraries to clean, explore, and interpret data. It replaces manual spreadsheet work with faster, repeatable scripts.
What is Python used for besides data analysis?
Python is used for web development, automation, artificial intelligence, and software development. Its versatility across fields is a major reason it remains one of the most popular programming languages.
Is Python hard to learn for data analysis?
Python is considered one of the easier programming languages to learn because of its readable syntax. Most beginners can handle basic data analysis tasks within a few weeks of consistent practice.
What is the best way to start learning Python for data analysis?
The best way to start is by installing Anaconda, opening a Jupyter Notebook, and practicing with a small real dataset. Free resources like Python.org and Kaggle support this learning path well.